


Contact our support team for more information.
Guardian BackstageTM 3.0 provides data and insights that help you stay informed on the activity in each of your projects registered with Guardian. Guardian Backstage can be accessed through Power BI or any other data-accessing service.
The database connection that is provided does not give direct access to the actual data used by Guardian installations. Rather, data is synchronized between the various production databases and services into this single, convenient connection for end users to consume.
Disclaimer: Data is currently retrieved and synchronized at intervals of roughly every 3 hours. This means a change may occur in Revit that will not immediately be shown in Backstage. We may modify the synchronization period without notifying users based on peak demand periods in order to optimize efficiency. Additionally, we may occasionally need to modify the structures, relationships, and naming of certain tables and field names. We’ll do our best to notify you of any changes so you may adjust your queries, etc. This document will be updated to match the current schemas for each release.
A Power BI template file is provided with the Guardian installer but can also be downloaded here.
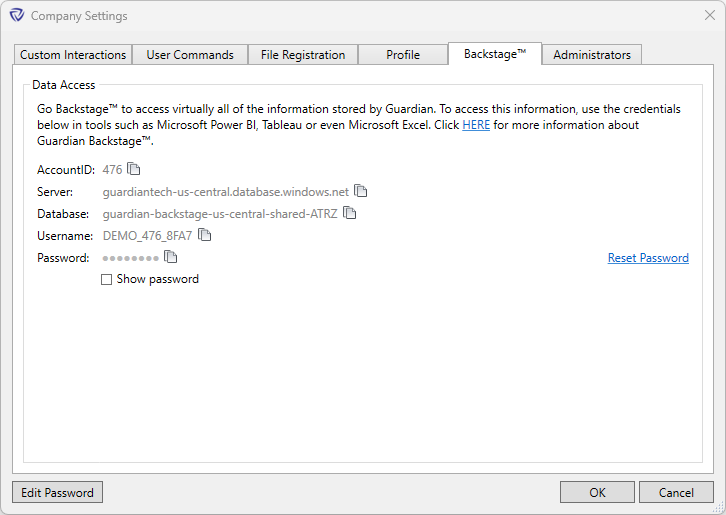
Before the data can be accessed, the Enable Data Access option must be selected in the Backstage tab within Company Settings (Settings > Company Settings > Backstage).

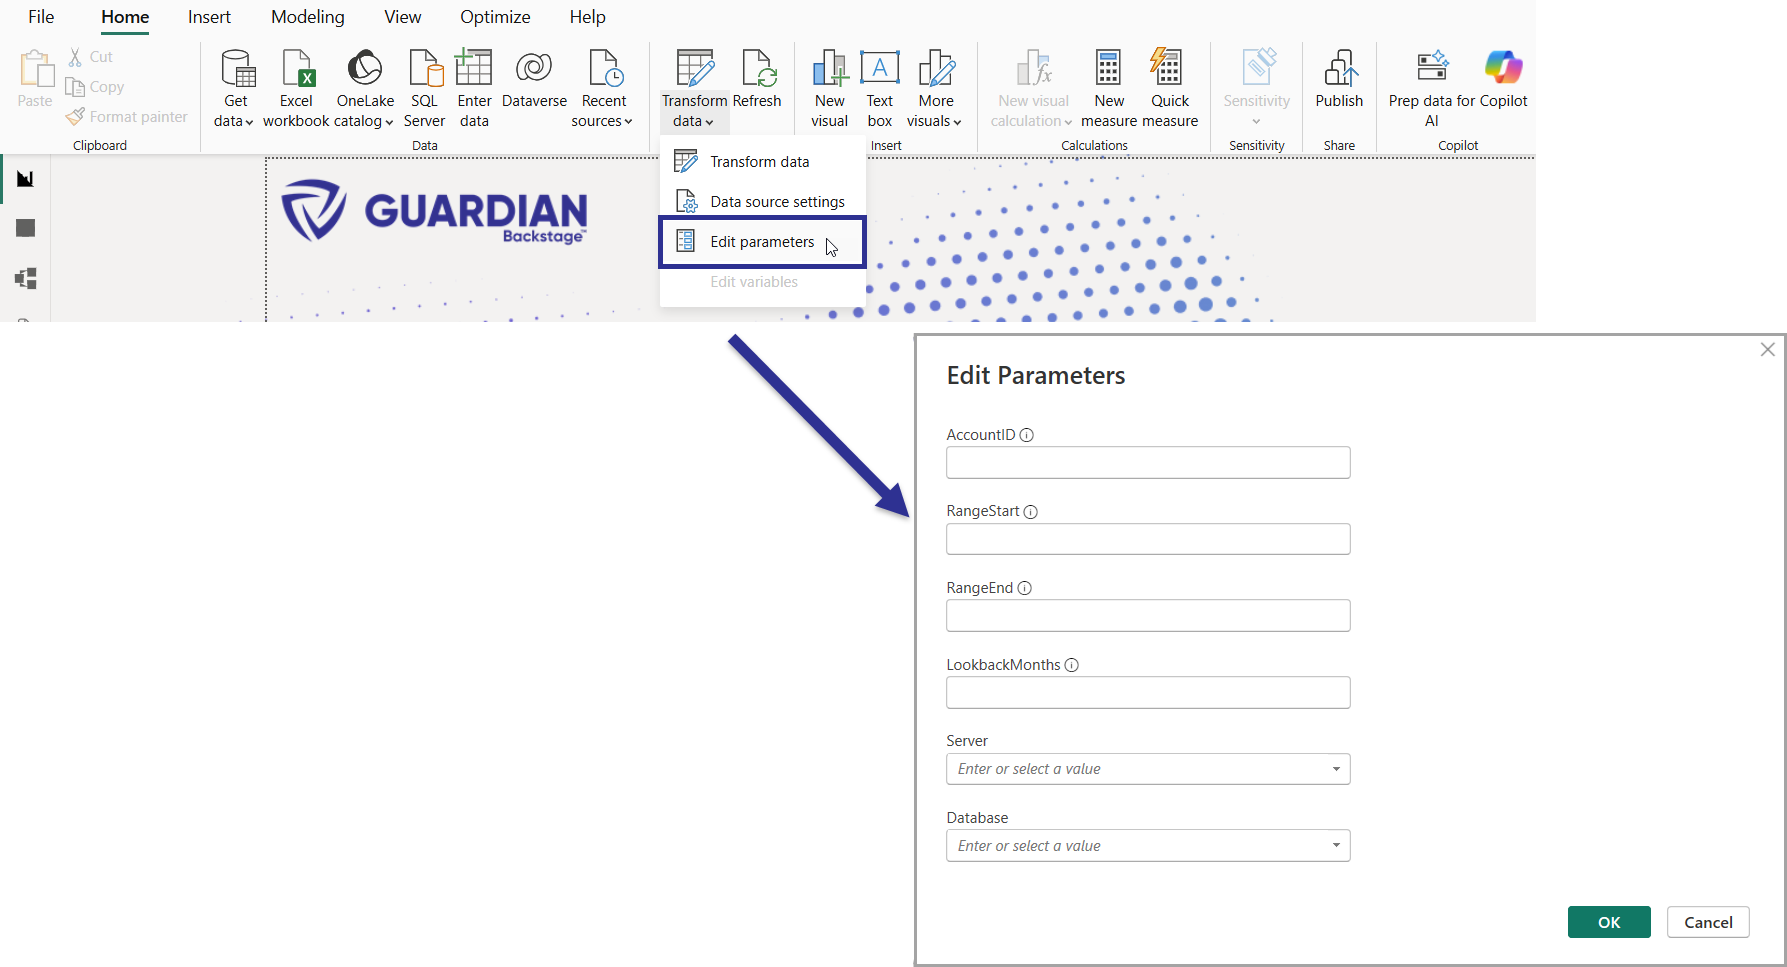
Open the template file, and a prompt will appear to input the AccountID, RangeStart, RangeEnd, LookbackMonths, Server, and Database.
The AccountID, Server, and Database can be found in the Backstage tab within Company Settings.
RangeStart and RangeEnd are for the incremental refresh feature. Learn more about Power BI’s incremental refresh. The incremental refresh dates should reflect the frequency with which you access the Power BI dashboard.
Enter a date [x/x/xxxx] for RangeStart, which would be a date in the past, such as 1/1/2024.
Enter a date [x/x/xxxx] for RangeEnd, which will be a date in the future, such as 12/31/2030.
Enter 12 for LookbackMonths and click Load. This is for the initial downloading of your data over the given number of months.
Power BI will then prompt you for the server credentials. Select the Database option on the left menu first, then enter your same credentials from the Guardian Backstage tab from the Company Settings dialog. The Database option will be carried over from the previous page. Click Connect.

The available data will then be loaded into the report, and your dashboard will be set up!
If Power BI didn't prompt you to input the above data or if you entered your credentials incorrectly, follow these steps.
1. In Power BI navigate to Transform data > Edit parameters. Copy the appropriate fields from the information available in Revit within your Guardian Settings > Company Settings > Backstage.
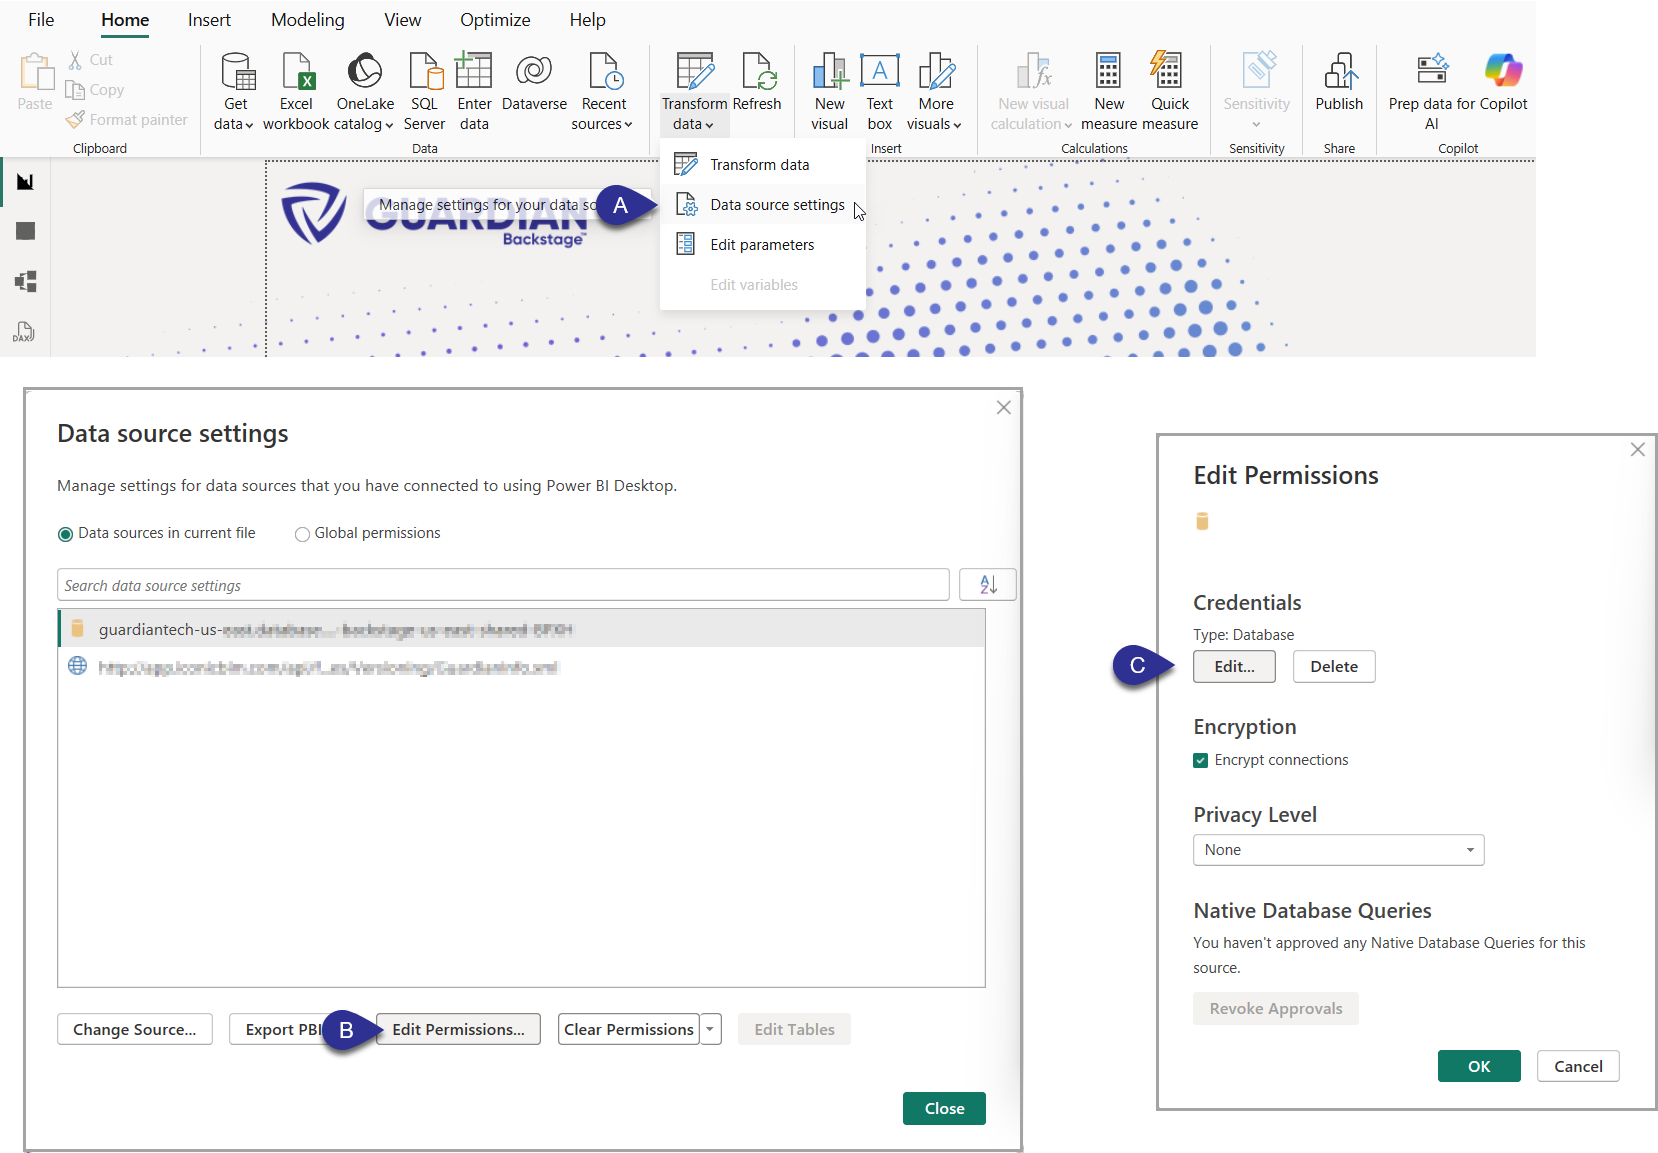
2. In Power BI navigate to Transform data > Data source settings (A) > Edit Permissions (B) > Edit (C). In the Database tab, enter your Backstage credentials available in Revit within your Guardian Settings > Company Settings > Backstage.
3. After entering the data select "Save", "OK", and "Close" until you're back at the Backstage main screen.
%20(5).png)
4. Hit the Refresh button in the ribbon found in the top center under the Home tab.
To view the most recent data, Power BI will need to be manually refreshed by clicking the Refresh button in the ribbon.

Backstage stores data on a timely basis (roughly every 3 hours). After a refresh, recent data may not be seen right away but should appear in about an hour or two.
Guardian Backstage provides many different pages that utilize the data captured by Guardian. Below is a list of the supplied pages and the data they provide:
Home
Installs
Usage
Projects
Highlights
Project Overview
Sessions:
Syncs:
Commands-All:
Commands-Detail:
Warnings-All:
Warnings-Detail:
Warnings-Snapshots:
Family Loading:
Mappings:
Properties:
Each page in the dashboard utilizes slicers at the top to help filter down the data. Most of these slicers are synced with the same ones on other pages. This allows a filter to be applied to many pages at once.

All the visualizations and tables on a page are also linked. Selecting a row within a table will filter down all the other data tables and graphs according to the selected data. For example, on the Commands-Detail page, a command in the Processed User Commands table can be selected and the other tables will show what elements were affected by that command, what view it was made in, and screenshots for before and after the command was used.
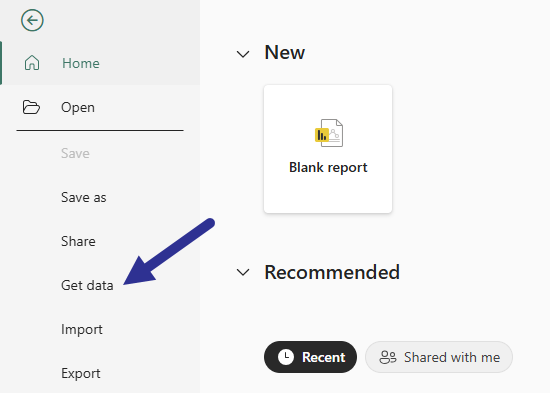
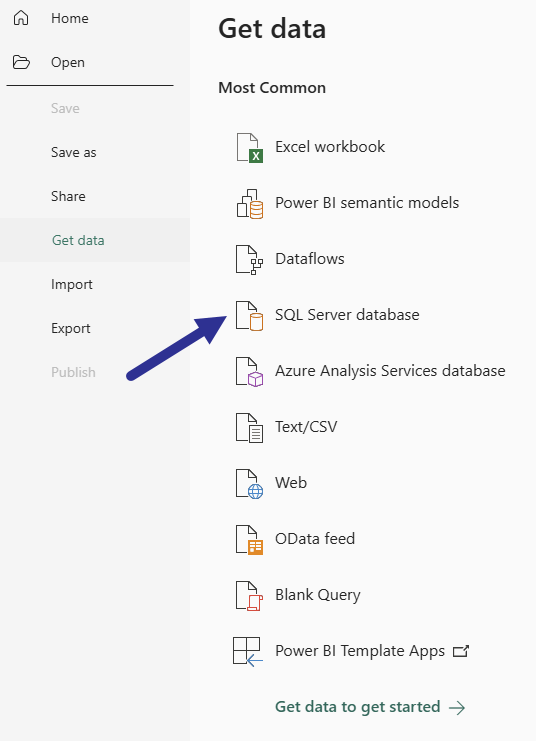
A dashboard can be created without the use of the Guardian template file. To accomplish this, open Power BI and set up a new data connection by selecting Get data.
Select the SQL Server database and then click Connect.
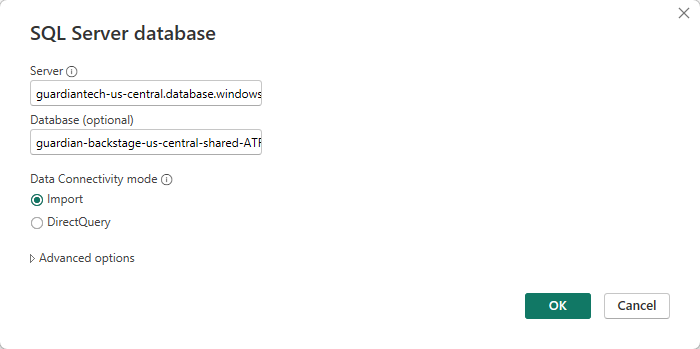
On the next dialog, enter the Server and Database information. This can be found in the Backstage tab under Company Settings. Click OK.
Power BI will then prompt you for the server credentials. Select the Database option on the left menu first, then enter your same credentials from the Backstage tab from the Company Settings dialog. The Database option will be carried over from the previous page. Click Connect.
On the next dialog, select the desired tables to import. It is recommended that all tables be included to receive all the analytical data.

Once the tables have been selected, click Load, and the report will be ready!
