

.png)

Project Central is a dashboard native to Revit that provides Project and Company Administrators with a more advanced look into the activity and health of each registered model in real time. Project Central allows Administrators to easily and quickly identify conflicts of company standards and rectify them.
For Company Administrators, the Project Central button is always available on the Revit ribbon. For Project Administrators, the Project Central button is only available for the projects to which they were assigned as Project Administrators.

Project Central can be accessed without having the project model open. Under the Projects dialog, simply find the project model in question and select the Project Central button at the bottom of the dialog. Administrators will have access to all the information that Project Central provides as if they were in the active project model.

Under Sync Traffic Control, all the active users within the model are listed, along with their sync activities. From here, Administrators can remind users to sync with central and keep tabs on their progress. Learn more about Sync Traffic Control.
In Project Central, Guardian Messages can be sent and received. Project Administrators will only be able to send messages to the projects and project groups they are assigned to. Company Administrators can send company-wide messages that will go to all Revit end users within the company who have Guardian installed. Learn more about Guardian Messages.
Project at a Glance provides a quick view of all the elements that users have allowed into the model in the ways Guardian is to help prevent. For some elements, such as Groups, a renaming button is provided to ensure elements are named following your standards and best practices. The Show in Project button provides administrators with direct access to the elements within the project model for further investigation.

Users at a Glance provides an overview of the activity of each user in the active model. By selecting the date filter, the list of users will update based on who has been in the model during that given timeframe. Selecting the Settings cog will provide a dropdown of specific data points within the Users at a Glance dialog that can be turned on or off. There are five distinct data sets provided.

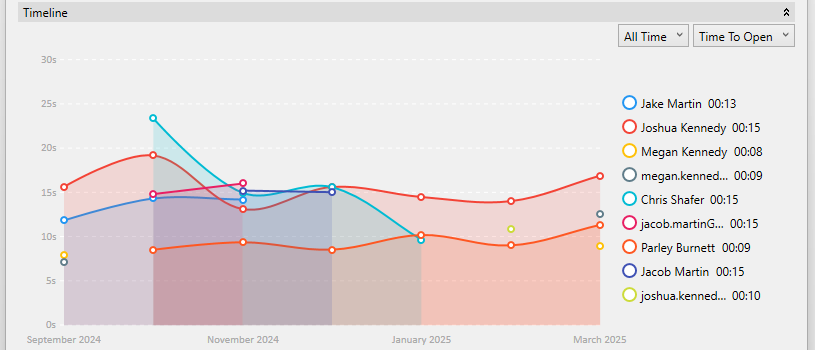
Project Central’s Timeline provides critical model performance data including Time to Open, Time to Sync, Warnings, Filesize, and Project Sessions. The time duration displayed for each of these can be filtered with the dropdown. Each node on the timeline offers tooltips to show further information for that data point.
The changes in the project model file size can be seen over the time frame selected.

Project Sessions show the duration of each user’s session for the active model. In this graph, the vertical black dotted lines represent when users have Synced with Central. The horizontal dashed lines indicate that the project model has been left open as the computer goes into sleep mode or is locked. Lines that do not terminate with a dot indicate the project model has been closed without syncing or possibly crashed.
By clicking on the session line of the individual user, the Activity Feed below will filter to all the activities performed during that project session.

Time to Open tracks how long it took each user to open the project model. Longer open times by everyone could indicate performance issues with the project model, while individuals with longer open times could indicate hardware or network issues associated with that user’s machine.
Time to Sync tracks how long it took for each user to sync with central. Similar to Time to Open, longer open times by everyone could indicate performance issues with the project model, while individuals with longer open times could indicate hardware or network issues associated with that user’s machine.

Warnings show how many warnings have been generated by individual users across a timeframe selected.

The Activity Feed provides real-time data on how users interact with the project model and Guardian’s proactive protection activity. The feed can be filtered by Commands, Revit warnings, sync with central, or Transactions.


User Commands are represented with the hand tools icon. The Protection Mode for each User Command will determine the color of the icon. For Monitor, Guide, and Prevent, the icons will show as green, yellow, and red, respectively. Clicking on these records will show additional information on the User Command that was used and any affected elements.


Transactions are represented with the download icon. The different color designations for these records refer to the number of individual properties affected in the Transaction. As the number of properties affected increases, the icon will change accordingly from green to yellow to red. Clicking these records will open the Project Properties dialog and filter the history to show the specific transaction.


Warnings are represented with the caution sign icon. The different color designations for these records are dependent on the applied settings for Revit Warning Tracking in the applied Project Configuration. Clicking these records will show additional information on the Revit warning and the affected elements.


Sync with Central logs are represented with the central model icon. The different color designations for these records indicate the length of time it took to synchronize the file with the central model. As sync times increase, the color of the icon will shift from green to yellow to red.
Project Central can be made available for Revit end users under Settings > Company Settings. Under the cog icon, the various sections of Project Central can be turned on or off depending on how much information is needed by the firm’s Revit end users.

Reach out to learn more, ask any questions, or meet the team! We'd love to learn more about your challenges and explore the more proactive solution.

